Banknaked vs Dividend Data
Side-by-side comparison to help you choose the right AI tool.
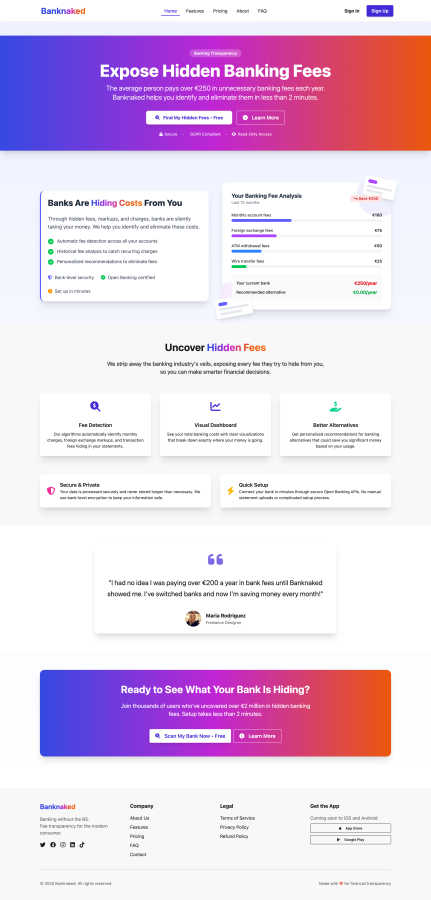
Banknaked
Stop your bank from lowkey robbing you by exposing every hidden fee in minutes.
Last updated: March 1, 2026
Dividend Data
Stop copy-pasting stock data and just use a formula to get dividends and financials instantly in your spreadsheet.
Last updated: March 11, 2026
Visual Comparison
Banknaked
Dividend Data

Feature Comparison
Banknaked
Forensic Fee Detection
Our algorithm is your personal financial detective. It automatically scans your connected accounts to sniff out every hidden cost—from monthly account maintenance fees and foreign exchange markups to ATM withdrawal charges and those suspicious "miscellaneous" line items. No more manually decoding your statement; we do the dirty work and present all the evidence in one place.
Crystal-Clear Visual Dashboard
Forget walls of text. We turn your complex fee data into simple, powerful visuals. See a pie chart of where your banking money really goes, a graph of your fees over the last year, and a stark comparison between what you're paying now versus what you could be saving. It's designed for that "oh, damn" moment of clarity.
Personalized Bank Recommendations
We don't just expose the problem and ghost you. Based on your actual spending and fee history, our system hunts down better banking alternatives that match your lifestyle. Get a tailored shortlist of accounts that could save you serious cash, turning our audit into an actionable escape plan from your overpriced bank.
Secure & Speedy Open Banking Setup
Your security is non-negotiable. We use certified, read-only Open Banking connections, so we can only see your transactions—we can never move your money. It's GDPR-compliant, encrypted, and set up in literal minutes. No uploading PDFs, no manual entry. Just secure access and instant insights.
Dividend Data
Spreadsheet Superpowers
This is the core magic. The add-in gives you a library of custom functions (like DIVIDENDDATA_DIVIDENDS, DIVIDENDDATA_RATIOS, etc.) that work directly in your cells. No more tab-hopping to finance sites. You build your own live, updating financial models and dashboards right inside the comfort of Google Sheets or Excel. It automates the tedious data-grunt work so you can focus on the actual analysis.
Deep Dividend & Fundamental Data Dive
Built for the income-focused crowd, it delivers the specific metrics you crave. Get forward dividends, yields, ex-dates, payout ratios, and dividend growth rates instantly. But it doesn't stop there; you also get the full context with PE ratios, EPS, revenue, balance sheet items, and over 100 other fundamental metrics. It's like having a direct feed from the market's brain into your spreadsheet.
30+ Years of Historical Context
You can't make smart decisions with just today's data. Dividend Data hooks you up with decades of historical data for those 80,000+ tickers. This lets you backtest strategies, analyze long-term trends, calculate compound growth rates, and see how a company performed through different market cycles. It's your financial time machine, no DeLorean required.
AI-Powered Research Assistant (Pro Terminal)
Beyond the spreadsheets, their flagship web app, the Dividend Data Terminal, includes an AI Analyst. This is your on-demand research buddy. Chat with it to get summaries, ask complex questions about stocks, and generate insights without digging through 10-Ks yourself. It supercharges your initial research phase before you even build your spreadsheet model.
Use Cases
Banknaked
The "Is My Free Account Actually Free?" Check
You signed up for a "free" current account years ago but have a sneaking suspicion it's not so free anymore. Connect with Banknaked to get the naked truth. We'll show you all the sneaky charges that have crept in, like paper statement fees or debit card replacement costs, so you can decide if it's time to jump ship.
Prepping to Negotiate with Your Bank
Walking into a bank negotiation blind is a losing game. Arm yourself with data first. Use Banknaked to get a full report of every fee you've paid. Then, call your bank, cite the exact figures, and use our alternative recommendations as leverage to demand fee waivers or a better deal. Knowledge is power (and savings).
The Annual Financial Health Audit
You check your credit score; why not your banking fee score? Make Banknaked part of your yearly money review. A quick two-minute scan can reveal new fees your bank has introduced or highlight recurring charges for services you stopped using, ensuring your banking setup is still optimized for your life.
The Frequent Traveler or Online Shopper
If you travel abroad or buy from international sites, your bank is likely ripping you off with FX markups and transaction fees. Banknaked isolates exactly how much you're overpaying on foreign exchange and then recommends specialist accounts or cards with far better rates, potentially saving you hundreds.
Dividend Data
Building a Dynamic Dividend Dashboard
Create a master spreadsheet that tracks your entire watchlist or portfolio. Use formulas to pull in live dividend yields, next ex-dates, payout ratios, and stock prices. Watch it update automatically, giving you a real-time snapshot of your income investments without manual refreshes. Perfect for tracking your dividend calendar.
Screening for Dividend Aristocrats & Growers
Use the historical data functions to screen for stocks with a proven track record. Build formulas that check for consecutive years of dividend growth, analyze growth rates over 5 or 10 years, and filter by safe payout ratios. You can create a powerful, custom stock screener that lives right in your Sheets or Excel.
Performing Deep-Dive Company Analysis
When you find a interesting stock, go deep. Pull 10 years of income statements, balance sheets, and cash flow statements directly into a sheet to build your own financial models and ratio analysis. Calculate trends in debt, margins, and returns on equity without ever leaving your workbook.
Automating Portfolio Performance Reports
Link your portfolio holdings and use Dividend Data to automatically pull in current prices, dividend amounts, and YTD performance metrics. Combine this with your share counts to calculate total portfolio value, projected annual income, and overall yield. Automate your monthly or quarterly performance review reports.
Overview
About Banknaked
Alright, let's cut through the corporate fluff. Your bank is playing you. They're stacking up sneaky little fees—monthly "maintenance," foreign exchange markups, random ATM charges—hoping you're too busy to notice the slow bleed from your account. Enter Banknaked: your financial wingman and ultimate BS detector. We're here to expose the truth. Think of us as an X-ray machine for your bank statement. Using secure, read-only Open Banking (we can't touch your money, promise), we connect to your account and perform a full forensic audit in under two minutes. We'll lay bare every single fee, translate that confusing bank-speak into plain English, and hit you with a scary-accurate projection of what you'll waste this year if you do nothing. But we're not just here to point out the problem. We give you the solution with personalized, data-driven recommendations for cheaper accounts that actually fit your life. Built for anyone who's ever felt their bank statement was hiding something, Banknaked is your tool to stop getting played, negotiate better, switch banks, or finally cancel services you never use. It's time for banking transparency, naked and raw.
About Dividend Data
Alright, let's cut through the Wall Street jargon. Dividend Data is your new bestie for stock analysis, but it lives where you already work: your spreadsheet. Think of it as a magic wand for Google Sheets and Microsoft Excel that summons decades of stock market intel with a simple formula. Done with copying and pasting data from sketchy websites or wrestling with complex API keys? This tool is built for that exact pain point. It's specifically crafted for dividend and fundamental investors who are tired of paying Bloomberg Terminal prices but still want that institutional-grade data. We're talking instant access to dividends, yields, payout ratios, growth rates, full financial statements, earnings, key ratios, price history, and over 100 other metrics. The best part? You just type something like =DIVIDENDDATA_DIVIDENDS("MSFT") and bam, the data appears live. It's got a legit free tier that doesn't ghost you after a trial (2,500 credits monthly, forever), covers over 80,000 tickers with 30+ years of history, and was built by a dividend investor who actually gets what you need. This is for the investor who wants to level up their research game without the institutional price tag or headache.
Frequently Asked Questions
Banknaked FAQ
Is Banknaked safe to use?
Totally. We use secure, regulatory-approved Open Banking (like what powers other fintech apps). This gives us read-only access, meaning we can see your transactions to analyze fees but we CANNOT touch, move, or withdraw your money. Ever. Your data is encrypted and we're fully GDPR compliant.
What banks do you work with?
We connect with virtually all major banks and many smaller ones across Europe through Open Banking APIs. The connection process will show you a list of supported institutions when you go to link your account. If your bank offers online banking, chances are we support it.
How do you make money if the scan is free?
Our core fee audit is completely free. We believe everyone deserves transparency. We may earn a small referral fee if you choose to switch to one of our recommended banking partners through our links. This never influences our recommendations—we always show you the best options for your situation.
What if I find a fee I don't understand?
We've got you! Every fee we detect comes with a plain-English explanation breaking down what it is and why your bank charged it. No jargon. If you're still confused, our blog and resources are full of info to help you become a fee-fighting pro.
Dividend Data FAQ
Is there really a free plan?
Yes, for real! The free plan gives you 2,500 credits every single month, and it never expires. No credit card needed to start. It's perfect for individual investors doing periodic research. You're not getting a 7-day trial that forces you to pay; you get a permanently useful free tier.
How do I get started? Is it complicated?
Not at all. If you use Google Sheets, just install the add-on from the Google Workspace Marketplace. For Excel, get it from Microsoft AppSource. Once installed, a sidebar will appear, and you can start typing the =DIVIDENDDATA... formulas directly into your cells. No coding, no API key setup.
What's the difference between the Spreadsheet add-in and the Pro Terminal?
The Spreadsheet add-in is about getting data into your existing workflow (Sheets/Excel). The Pro Terminal is their full web application with advanced data visualizations, the AI Analyst for chat-based research, and automated portfolio tracking tools. They complement each other; many users start with the spreadsheets and upgrade to the Terminal for deeper analysis.
What counts as a "credit"?
A credit is typically used each time you call a formula that fetches new data. For example, using =DIVIDENDDATA_QUOTE("AAPL", "price") might cost 1 credit. Pulling a longer history might cost a few more. The system is designed so the 2,500 free credits are plenty for substantial individual use.
Alternatives
Banknaked Alternatives
Alright, so you've heard about Banknaked, the app that acts like a financial detective, sniffing out all those hidden fees your bank hopes you'll never see. It's basically your digital wingman in the business and finance world, giving you the receipts on where your money is actually going. People might look for other options for all sorts of reasons. Maybe they want a different vibe, need specific features we don't have, or are just curious what else is out there in the money-tracking universe. It's all good, the goal is to stop getting low-key robbed, no matter how you do it. When you're scouting for a similar tool, keep your eyes peeled for a few key things. You want something that's dead simple to use, actually connects to your bank safely, and doesn't just show you the problem but also helps you fix it with smart, personalized advice. The whole point is to get clarity without the headache.
Dividend Data Alternatives
So you've heard about Dividend Data, the tool that slaps 30+ years of stock market intel for 80k+ tickers straight into your Sheets or Excel. No API keys, no coding, just simple formulas. It's basically the cheat code for dividend and fundamental investors who want deep data without the Wall Street price tag. People hunt for alternatives for all the usual suspects. Maybe the pricing feels off, they need a feature that's missing, or their workflow lives on a different platform entirely. It's all about finding the right fit for your specific investing grind. When you're scoping out other options, keep your non-negotiables front of mind. Think about your budget (free tiers are a vibe), the specific data points you absolutely need, whether it plays nice with your spreadsheet of choice, and if the historical data goes back far enough for your strategy. Don't sleep on the user experience either—if it's clunky, you just won't use it.