conceptviz vs Fusedash
Side-by-side comparison to help you choose the right AI tool.
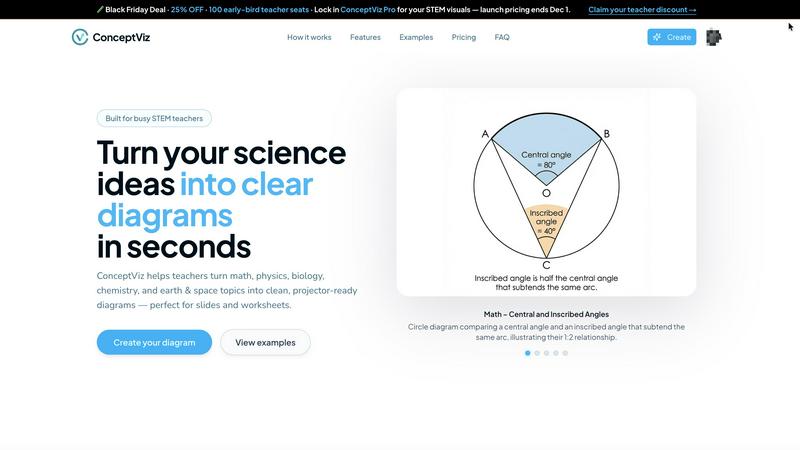
ConceptViz makes turning your science and math ideas into clear, slick diagrams super easy for classrooms and research.
Last updated: March 1, 2026
Fusedash transforms your raw data into slick dashboards and charts, making insights easy to spot and act on fast.
Last updated: March 4, 2026
Visual Comparison
conceptviz
Fusedash

Feature Comparison
conceptviz
Easy Three-Step Process
ConceptViz makes creating diagrams a breeze with a three-step process. Sign in, describe the visual you need, and generate it instantly. No complicated software skills required!
Projector-Ready Clarity
Every diagram you create is designed to look sharp and clear on projectors. With thick lines and legible labels, your visuals will grab attention from the front row to the back.
Subject and Grade Presets
You can start with presets tailored specifically for various STEM subjects and grade levels. Whether it’s physics, biology, or chemistry, you have quick options that fit perfectly in K-12 and beyond.
High-Resolution Downloads
ConceptViz allows you to download high-resolution PNG images that are perfect for slides or printouts. This means you can easily incorporate your diagrams into PowerPoint or Google Slides without losing quality.
Fusedash
Flexible Views
Fusedash lets you customize how your data is presented, catering to the needs of different teams. Whether it's a dashboard, chart, map, or narrative report, you can tailor layouts, filters, and time ranges to make sure stakeholders get exactly what they need without endless back and forth.
AI Chart Generator
Generate stunning visuals from your data in just minutes! Fusedash's AI chart generator takes your CSVs or API data, helps you choose the right chart type, and lets you add comparisons and clear labels. This means your charts will not only look good but also tell the right story.
Dashboard Software
Combine monitoring with context in one sleek workspace. Fusedash allows you to create dashboards that track KPIs while also providing narrative reports to explain changes and their significance. This storytelling feature keeps everyone aligned and reduces confusion, ensuring that everyone knows what’s up.
AI Chat
Not sure where to start? No worries! Fusedash's Smart Chat lets you ask questions in plain language and get immediate suggestions for metrics, charts, and breakdowns. This feature makes it easy to turn insights into shareable dashboard views, speeding up the decision-making process.
Use Cases
conceptviz
Classroom Presentations
Teachers can use ConceptViz to create engaging visuals for their classroom presentations. Imagine having a custom diagram that perfectly illustrates your lesson without any hassle.
Student Projects
Students can leverage ConceptViz for their science projects, generating diagrams that clearly explain their concepts. This way, they can present their findings with confidence and style.
Research Papers
Researchers can quickly generate diagrams for academic papers or presentations. The ability to create accurate visuals on demand saves time and enhances the quality of their work.
Study Aids
ConceptViz is perfect for creating study aids. Students can design diagrams that summarize key concepts, making it easier to review for tests or exams.
Fusedash
Marketing Campaign Tracking
Keep tabs on your marketing campaigns by utilizing Fusedash to create dashboards that show real-time performance metrics. You can visualize data trends and quickly adjust strategies based on what's working and what's not.
Sales Performance Monitoring
Sales teams can leverage Fusedash to track performance metrics across different regions or products. With customizable dashboards, you can visualize sales numbers, compare them against KPIs, and quickly identify areas for improvement.
Operational Efficiency Analysis
Operations teams can utilize Fusedash to monitor key performance indicators in real-time. By using storytelling features, you can provide context to the data, helping teams understand operational successes and challenges.
Financial Reporting
Finance departments can streamline their reporting processes with Fusedash. Create comprehensive dashboards that pull from multiple data sources, ensuring that stakeholders have access to accurate financial insights without the headache of manual reporting.
Overview
About conceptviz
Yo, educators and science buffs! Say hello to ConceptViz, your new best buddy for crafting classroom-ready science diagrams in a flash. This tool is a game-changer for STEM teachers, students, and researchers who need to transform complex concepts into super clear visuals without the hassle of endless image searches. Forget about settling for “almost right” images that don’t quite fit your lesson plans. With ConceptViz, you can whip up stunning, projector-ready diagrams in mere seconds. Whether you're in a K-12 classroom or tackling university-level research, ConceptViz has got your back. From illustrating Newton's laws to breaking down the structure of a cell, this tool turns your plain explanations into eye-popping visuals that are ready to dazzle in presentations or handouts. Plus, it’s designed with real classrooms in mind, ensuring that your diagrams are not just pretty but also practical and effective. Time to ditch the stress of prepping visuals and start teaching with style!
About Fusedash
Fusedash is like that magical toolbox you always wanted for your data! It's an AI-driven data visualization platform that helps teams convert their connected data into clear, actionable insights. Whether you're in marketing, operations, or leadership, Fusedash is designed to make your life easier by eliminating those frustrating manual reporting cycles and conflicting data stories. Imagine a unified workspace where you can whip up decision-ready dashboards, interactive charts, detailed maps, and narrative reports without the hassle of piecing together different tools. With Fusedash, you set your key metrics and KPIs once, and then use those definitions across all views and reports, ensuring everyone in your organization is on the same page with the same trusted numbers. It's not just about monitoring what's happening; it's about understanding why it's happening. Thanks to integrated AI features like natural language data chat and smart visualization assistance, Fusedash makes data exploration and reporting not just faster, but also way more accessible. Turn your raw data into a shared source of truth that drives alignment and action. Say goodbye to chaos and hello to clarity!
Frequently Asked Questions
conceptviz FAQ
What subjects does ConceptViz support?
ConceptViz covers a wide range of subjects, including physics, biology, chemistry, earth and space science, and math, making it suitable for various educational levels.
Do I need any design skills to use ConceptViz?
Not at all! ConceptViz is designed for everyone, so you don't need any design or drawing skills. Just describe what you need, and let the tool do the work for you.
Can I download the diagrams I create?
Absolutely! You can download your diagrams in high-resolution PNG format, perfect for use in presentations, worksheets, or any other educational materials.
Is there a free trial available?
Yes! ConceptViz offers a free 4K Ultra HD trial, so you can try it out without a credit card. See how it works and create stunning visuals before committing to a plan.
Fusedash FAQ
How does Fusedash ensure data consistency?
Fusedash allows you to define your key metrics and KPIs once, which can then be reused across all views and reports. This ensures that every team in your organization is looking at the same trusted numbers, eliminating conflicting reports.
Can I integrate my existing data sources with Fusedash?
Absolutely! Fusedash lets you upload CSVs, connect APIs, and even enrich your datasets with public data. This flexibility means you can combine various data sources without having to rebuild your reports from scratch.
Is Fusedash user-friendly for non-technical users?
Definitely! Fusedash is designed to be intuitive and accessible. With features like the AI Chat, even those without a technical background can easily explore data, generate charts, and create dashboards without feeling overwhelmed.
What kind of support does Fusedash offer?
Fusedash provides various resources including demos, tutorials, and a knowledge base to help users get started. Their customer support team is also available to assist with any questions or issues you might encounter along the way.
Alternatives
conceptviz Alternatives
ConceptViz is a rad tool designed to help educators and researchers whip up stunning diagrams for science and math concepts in a flash. As part of the design tools category, it's perfect for anyone looking to transform complex ideas into visual forms that pop. However, users often seek alternatives due to reasons like pricing, specific feature sets, or the need for compatibility across different platforms. When hunting for alternatives, keep an eye out for user-friendly interfaces, customization options, and the quality of the visuals produced. It's crucial to find a tool that aligns with your teaching style and meets your specific subject needs without causing a headache during prep time.
Fusedash Alternatives
Fusedash is an AI-powered data visualization platform that transforms your raw data into slick dashboards and charts, making sure your squad can act on insights like a boss. It falls under the Analytics & Data and Business Intelligence categories, catering to teams that want to ditch the hassle of manual reporting and conflicting data stories. Users often search for alternatives when they feel like Fusedash might not fit their budget, lack specific features they need, or require compatibility with certain platforms. When hunting for an alternative, keep an eye out for pricing structures that align with your budget, essential features that meet your unique needs, and compatibility with your existing tools. It's all about finding a solution that keeps the vibe flowing and the insights rolling in without a hitch.