Dividend Data vs QuickData.ai
Side-by-side comparison to help you choose the right AI tool.
Dividend Data
Stop copy-pasting stock data and just use a formula to get dividends and financials instantly in your spreadsheet.
Last updated: March 11, 2026
QuickData.ai
Stop wasting hours on data entry and underwrite multifamily deals 10x faster with AI.
Last updated: March 1, 2026
Visual Comparison
Dividend Data

QuickData.ai
Feature Comparison
Dividend Data
Spreadsheet Superpowers
This is the core magic. The add-in gives you a library of custom functions (like DIVIDENDDATA_DIVIDENDS, DIVIDENDDATA_RATIOS, etc.) that work directly in your cells. No more tab-hopping to finance sites. You build your own live, updating financial models and dashboards right inside the comfort of Google Sheets or Excel. It automates the tedious data-grunt work so you can focus on the actual analysis.
Deep Dividend & Fundamental Data Dive
Built for the income-focused crowd, it delivers the specific metrics you crave. Get forward dividends, yields, ex-dates, payout ratios, and dividend growth rates instantly. But it doesn't stop there; you also get the full context with PE ratios, EPS, revenue, balance sheet items, and over 100 other fundamental metrics. It's like having a direct feed from the market's brain into your spreadsheet.
30+ Years of Historical Context
You can't make smart decisions with just today's data. Dividend Data hooks you up with decades of historical data for those 80,000+ tickers. This lets you backtest strategies, analyze long-term trends, calculate compound growth rates, and see how a company performed through different market cycles. It's your financial time machine, no DeLorean required.
AI-Powered Research Assistant (Pro Terminal)
Beyond the spreadsheets, their flagship web app, the Dividend Data Terminal, includes an AI Analyst. This is your on-demand research buddy. Chat with it to get summaries, ask complex questions about stocks, and generate insights without digging through 10-Ks yourself. It supercharges your initial research phase before you even build your spreadsheet model.
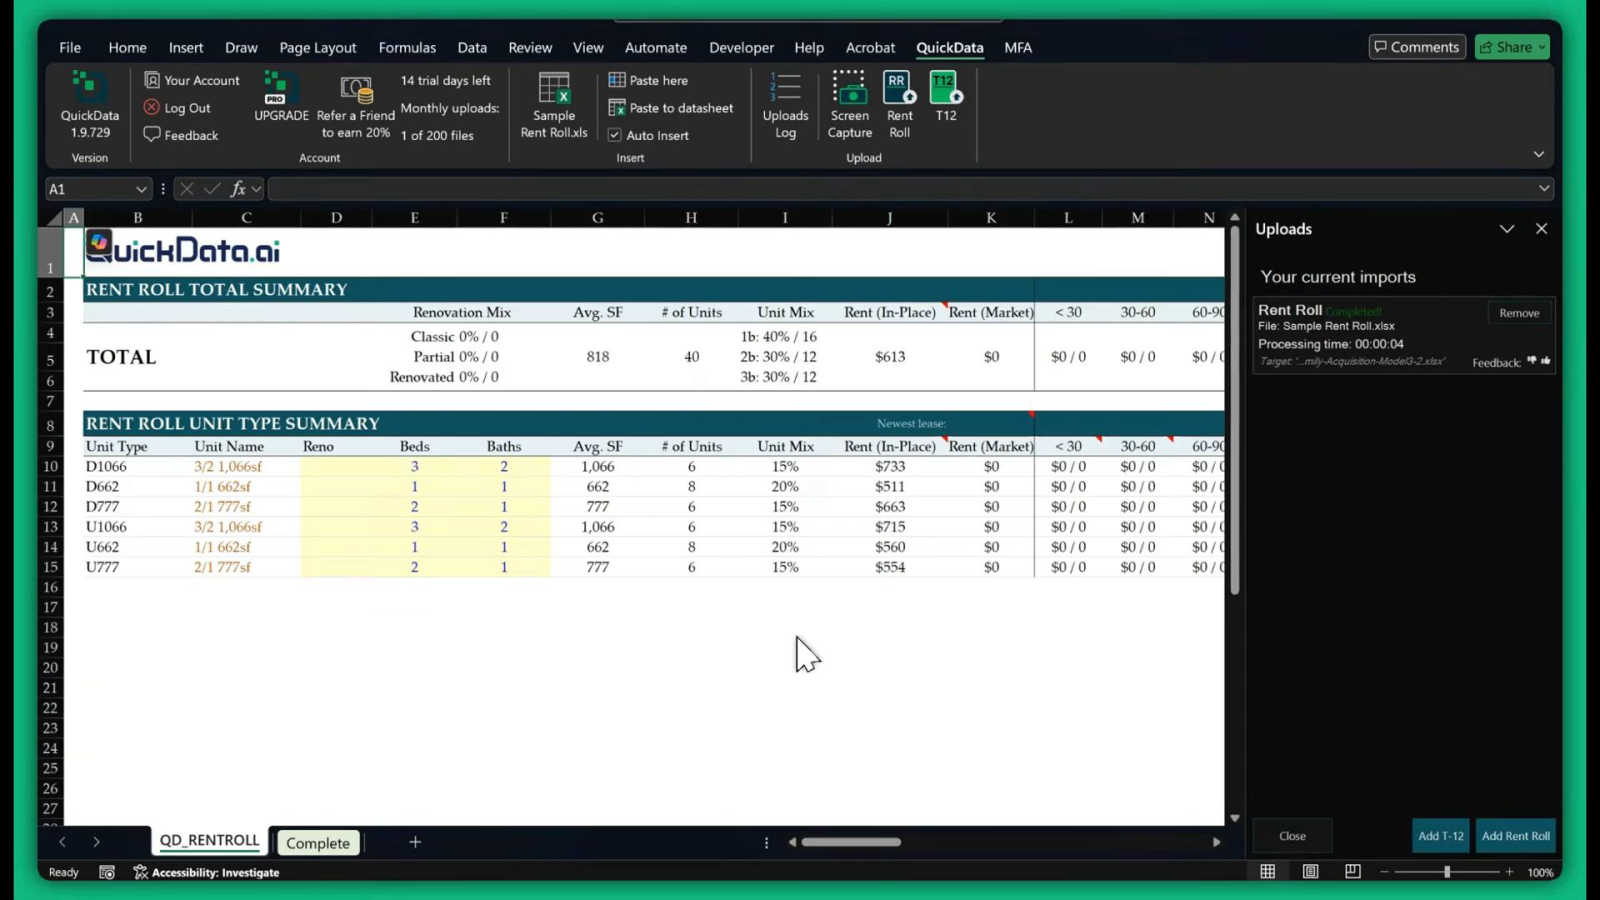
QuickData.ai
AI-Powered Data Extraction
This is the core magic. The AI doesn't just read your documents; it understands them. Upload a rent roll PDF, a T12 statement, or an OM, and our brainy bot instantly identifies and extracts key metrics like unit mixes, rental income, expenses, and vacancy rates. It's like having OCR on steroids that actually knows what a "Gross Potential Rent" is and where to put it. No more squinting at tiny PDF print or fixing formatting nightmares.
Direct Excel Integration
The whole point is to skip the middleman, right? QuickData.ai plugs directly into Excel as an add-in. Once the AI extracts the data, it doesn't dump it into some random portal—it flows straight into your existing, beloved (or hated) Excel underwriting model. The fields map automatically, keeping your formulas and structure intact. It's a seamless, "set it and forget it" kind of operation that feels like dark Excel wizardry.
Multifamily-Specific Smarts
This isn't a generic data scraper. It's trained specifically on multifamily real estate docs. It knows the difference between a T12 and a rent roll, understands pro forma adjustments, and recognizes the key data points that actually matter for underwriting. You're not teaching it the business; it already speaks your language, saving you from endless configuration and manual corrections.
Setup in Minutes, Cancel Anytime
We hate complicated onboarding as much as you do. Getting started is stupid simple: install the add-in, connect it, and you're pretty much ready to roll. They even offer free 1:1 onboarding to get you humming. And with a 14-day free trial and a cancel-anytime policy, there's zero risk to test drive this beast and see those hours come flooding back into your life.
Use Cases
Dividend Data
Building a Dynamic Dividend Dashboard
Create a master spreadsheet that tracks your entire watchlist or portfolio. Use formulas to pull in live dividend yields, next ex-dates, payout ratios, and stock prices. Watch it update automatically, giving you a real-time snapshot of your income investments without manual refreshes. Perfect for tracking your dividend calendar.
Screening for Dividend Aristocrats & Growers
Use the historical data functions to screen for stocks with a proven track record. Build formulas that check for consecutive years of dividend growth, analyze growth rates over 5 or 10 years, and filter by safe payout ratios. You can create a powerful, custom stock screener that lives right in your Sheets or Excel.
Performing Deep-Dive Company Analysis
When you find a interesting stock, go deep. Pull 10 years of income statements, balance sheets, and cash flow statements directly into a sheet to build your own financial models and ratio analysis. Calculate trends in debt, margins, and returns on equity without ever leaving your workbook.
Automating Portfolio Performance Reports
Link your portfolio holdings and use Dividend Data to automatically pull in current prices, dividend amounts, and YTD performance metrics. Combine this with your share counts to calculate total portfolio value, projected annual income, and overall yield. Automate your monthly or quarterly performance review reports.
QuickData.ai
For Acquisitions Teams Underwriting a New Deal
Your team just got a new deal package with a 50-page OM and a massive rent roll. Instead of dividing and conquering the manual data entry for the next day, one person uploads the docs to QuickData.ai. In minutes, the core financials are populated in your team's standard model, letting you jump straight to analysis, sensitivity testing, and deciding whether to pull the trigger. You underwrite 10x faster and get first dibs.
For Brokers Creating Offering Memorandums
As a broker, you're often handed a seller's messy financials. To create a clean, compelling OM, you need to organize that data fast. Use QuickData.ai to instantly extract the historical performance (T12) and current occupancy (rent roll) data. This gives you a clean, accurate starting point to build your story and market the property, making you look like an efficiency wizard to your clients.
For Lenders & Debt Funds Doing Diligence
When reviewing a loan application, you need to quickly verify the property's performance data against the sponsor's model. Manually checking line-by-line is a snooze-fest. With QuickData.ai, you can extract the actual T12 and rent roll data from the provided documents and instantly compare it to the submitted projections, spotting discrepancies in record time and mitigating risk.
For Analysts Tired of Repetitive Tasks
If your job is building or updating portfolio models with new data every month/quarter, you're stuck on a hamster wheel of copy-pasting. QuickData.ai automates this entire workflow. Point it at the new statements, and it refreshes your models automatically. This frees you up for higher-value work like deep-dive analysis or modeling complex scenarios, finally using your brain for more than data entry.
Overview
About Dividend Data
Alright, let's cut through the Wall Street jargon. Dividend Data is your new bestie for stock analysis, but it lives where you already work: your spreadsheet. Think of it as a magic wand for Google Sheets and Microsoft Excel that summons decades of stock market intel with a simple formula. Done with copying and pasting data from sketchy websites or wrestling with complex API keys? This tool is built for that exact pain point. It's specifically crafted for dividend and fundamental investors who are tired of paying Bloomberg Terminal prices but still want that institutional-grade data. We're talking instant access to dividends, yields, payout ratios, growth rates, full financial statements, earnings, key ratios, price history, and over 100 other metrics. The best part? You just type something like =DIVIDENDDATA_DIVIDENDS("MSFT") and bam, the data appears live. It's got a legit free tier that doesn't ghost you after a trial (2,500 credits monthly, forever), covers over 80,000 tickers with 30+ years of history, and was built by a dividend investor who actually gets what you need. This is for the investor who wants to level up their research game without the institutional price tag or headache.
About QuickData.ai
Alright, listen up, number crunchers and deal junkies. If you're in the multifamily real estate game, you know the drill: you're drowning in PDFs—rent rolls, T12s, offering memorandums—and your job is basically to be a human copy-paste machine, manually shoveling data into your sacred Excel underwriting models. It's tedious, error-prone, and a total vibe killer. Enter QuickData.ai, your new AI-powered sidekick that's about to make that whole process look as ancient as a flip phone. This isn't just another tool; it's a full-blown revolution in an Excel add-in. Think of it as that genius intern who never sleeps, never complains, and can instantly extract all the crucial figures from your documents and plop them perfectly into your spreadsheet. We're talking about automating the soul-sucking data entry that usually eats 15+ hours of your month. Built specifically for multifamily pros—acquisitions teams, brokers, lenders, you name it—QuickData.ai is your ticket to underwriting deals at ludicrous speed, cutting out errors, and freeing you up to actually analyze deals and, you know, close them. It's the upgrade your workflow desperately needs.
Frequently Asked Questions
Dividend Data FAQ
Is there really a free plan?
Yes, for real! The free plan gives you 2,500 credits every single month, and it never expires. No credit card needed to start. It's perfect for individual investors doing periodic research. You're not getting a 7-day trial that forces you to pay; you get a permanently useful free tier.
How do I get started? Is it complicated?
Not at all. If you use Google Sheets, just install the add-on from the Google Workspace Marketplace. For Excel, get it from Microsoft AppSource. Once installed, a sidebar will appear, and you can start typing the =DIVIDENDDATA... formulas directly into your cells. No coding, no API key setup.
What's the difference between the Spreadsheet add-in and the Pro Terminal?
The Spreadsheet add-in is about getting data into your existing workflow (Sheets/Excel). The Pro Terminal is their full web application with advanced data visualizations, the AI Analyst for chat-based research, and automated portfolio tracking tools. They complement each other; many users start with the spreadsheets and upgrade to the Terminal for deeper analysis.
What counts as a "credit"?
A credit is typically used each time you call a formula that fetches new data. For example, using =DIVIDENDDATA_QUOTE("AAPL", "price") might cost 1 credit. Pulling a longer history might cost a few more. The system is designed so the 2,500 free credits are plenty for substantial individual use.
QuickData.ai FAQ
What kind of documents can QuickData.ai read?
It's built specifically for the multifamily real estate world, so it's a pro at reading Rent Rolls (showing current occupancy, rents, and unit mixes), T12 (Trailing 12-Month) income statements, and Offering Memorandums (OMs). It extracts the key financial and operational data from these PDFs that you need for underwriting.
How does the data get into my Excel model?
You install QuickData.ai as an add-in directly into Microsoft Excel. Once you process a document through the AI, it maps the extracted data points (like total monthly rental income, expenses, etc.) into the correct cells within your existing Excel spreadsheet. You don't need to use a special template; it works with your model.
Is it really accurate? I can't afford errors.
The AI is trained on thousands of multifamily documents to be highly accurate, and it's constantly learning. It significantly reduces human error from manual typing or copy-pasting. For ultimate peace of mind, it's always good practice to do a quick sense-check on the populated numbers—but it'll handle the heavy, error-prone lifting.
What's the catch with the 14-day free trial?
There isn't one! The trial gives you full access to all the features so you can see exactly how much time it saves you on real deals. No credit card is required upfront for the trial. If you love it, you can choose a plan. If it's not for you, just cancel—no awkward emails, no hassle.
Alternatives
Dividend Data Alternatives
So you've heard about Dividend Data, the tool that slaps 30+ years of stock market intel for 80k+ tickers straight into your Sheets or Excel. No API keys, no coding, just simple formulas. It's basically the cheat code for dividend and fundamental investors who want deep data without the Wall Street price tag. People hunt for alternatives for all the usual suspects. Maybe the pricing feels off, they need a feature that's missing, or their workflow lives on a different platform entirely. It's all about finding the right fit for your specific investing grind. When you're scoping out other options, keep your non-negotiables front of mind. Think about your budget (free tiers are a vibe), the specific data points you absolutely need, whether it plays nice with your spreadsheet of choice, and if the historical data goes back far enough for your strategy. Don't sleep on the user experience either—if it's clunky, you just won't use it.
QuickData.ai Alternatives
QuickData.ai is that slick AI assistant that lives in your Excel, automating the soul-crushing task of entering rent roll and T12 data for multifamily deals. It's basically a cheat code for real estate underwriters who'd rather analyze deals than copy-paste numbers all day. People hunt for alternatives for all the usual suspects. Maybe the pricing isn't a perfect fit for their budget, or they need a feature that works on a different platform besides Excel. Sometimes a team just vibes better with a different UI or needs a tool that handles even more document types. When you're shopping around, keep your non-negotiables in focus. Think about your budget, what specific documents you need to parse (just rent rolls? something else?), and how deep you need the Excel integration to be. The goal is to find your own personal data-slaying sidekick.