Dividend Data vs echoloc
Side-by-side comparison to help you choose the right AI tool.
Dividend Data
Stop copy-pasting stock data and just use a formula to get dividends and financials instantly in your spreadsheet.
Last updated: March 11, 2026
Echoloc turns job posts into goldmines of buyer intent, helping sales teams target accounts ready to buy.
Last updated: February 28, 2026
Visual Comparison
Dividend Data

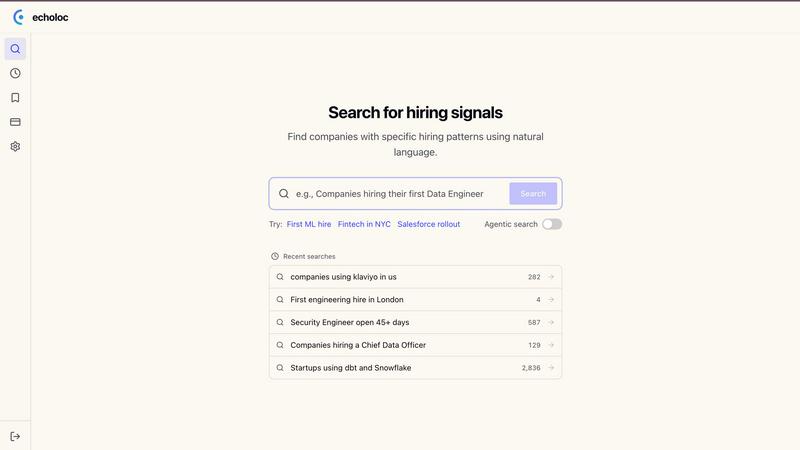
echoloc
Feature Comparison
Dividend Data
Spreadsheet Superpowers
This is the core magic. The add-in gives you a library of custom functions (like DIVIDENDDATA_DIVIDENDS, DIVIDENDDATA_RATIOS, etc.) that work directly in your cells. No more tab-hopping to finance sites. You build your own live, updating financial models and dashboards right inside the comfort of Google Sheets or Excel. It automates the tedious data-grunt work so you can focus on the actual analysis.
Deep Dividend & Fundamental Data Dive
Built for the income-focused crowd, it delivers the specific metrics you crave. Get forward dividends, yields, ex-dates, payout ratios, and dividend growth rates instantly. But it doesn't stop there; you also get the full context with PE ratios, EPS, revenue, balance sheet items, and over 100 other fundamental metrics. It's like having a direct feed from the market's brain into your spreadsheet.
30+ Years of Historical Context
You can't make smart decisions with just today's data. Dividend Data hooks you up with decades of historical data for those 80,000+ tickers. This lets you backtest strategies, analyze long-term trends, calculate compound growth rates, and see how a company performed through different market cycles. It's your financial time machine, no DeLorean required.
AI-Powered Research Assistant (Pro Terminal)
Beyond the spreadsheets, their flagship web app, the Dividend Data Terminal, includes an AI Analyst. This is your on-demand research buddy. Chat with it to get summaries, ask complex questions about stocks, and generate insights without digging through 10-Ks yourself. It supercharges your initial research phase before you even build your spreadsheet model.
echoloc
Smart Job Signal Analysis
Echoloc dives deep into job postings to unveil hidden buying signals. It translates HR noise into actionable insights, helping sales teams understand when companies are ready to invest based on their hiring patterns.
Real-Time Updates
Stay in the loop with real-time updates on job postings and hiring trends. With Echoloc, you get fresh data on companies that are actively looking to expand, ensuring your outreach is always relevant and timely.
Evidence-Based Results
Forget about stale lists and vague leads. Echoloc provides clear proof with every match, showing snippets from job posts so you can see exactly why a company is a hot prospect. It's all about transparency and actionable intelligence.
Intuitive Search Functionality
Searching for potential leads is a breeze with Echoloc's user-friendly interface. Just type in what you're looking for in plain English, and the platform does the heavy lifting, delivering precise results that match your criteria.
Use Cases
Dividend Data
Building a Dynamic Dividend Dashboard
Create a master spreadsheet that tracks your entire watchlist or portfolio. Use formulas to pull in live dividend yields, next ex-dates, payout ratios, and stock prices. Watch it update automatically, giving you a real-time snapshot of your income investments without manual refreshes. Perfect for tracking your dividend calendar.
Screening for Dividend Aristocrats & Growers
Use the historical data functions to screen for stocks with a proven track record. Build formulas that check for consecutive years of dividend growth, analyze growth rates over 5 or 10 years, and filter by safe payout ratios. You can create a powerful, custom stock screener that lives right in your Sheets or Excel.
Performing Deep-Dive Company Analysis
When you find a interesting stock, go deep. Pull 10 years of income statements, balance sheets, and cash flow statements directly into a sheet to build your own financial models and ratio analysis. Calculate trends in debt, margins, and returns on equity without ever leaving your workbook.
Automating Portfolio Performance Reports
Link your portfolio holdings and use Dividend Data to automatically pull in current prices, dividend amounts, and YTD performance metrics. Combine this with your share counts to calculate total portfolio value, projected annual income, and overall yield. Automate your monthly or quarterly performance review reports.
echoloc
Targeting New Market Opportunities
When a startup hires its first machine learning engineer, it’s a clear indicator of investment in AI tech. Echoloc helps identify these companies early on, allowing sales teams to approach them before the competition catches on.
Rapid Growth Assessment
With Echoloc, you can spot companies experiencing hiring spikes, like fintechs ramping up their engineering teams. This info allows you to tailor your outreach and pitch relevant solutions that meet their immediate scaling needs.
Strategic Account Management
Sales professionals can utilize Echoloc to keep tabs on key accounts showing signs of expansion or change, such as new leadership hires. This insight is gold for nurturing relationships and pitching new ideas at the right time.
Proactive Sales Outreach
Echoloc lets you catch leads showing urgent hiring pain, like roles open for over 45 days. These companies are often more willing to buy solutions to alleviate their staffing challenges, making them prime targets for outreach.
Overview
About Dividend Data
Alright, let's cut through the Wall Street jargon. Dividend Data is your new bestie for stock analysis, but it lives where you already work: your spreadsheet. Think of it as a magic wand for Google Sheets and Microsoft Excel that summons decades of stock market intel with a simple formula. Done with copying and pasting data from sketchy websites or wrestling with complex API keys? This tool is built for that exact pain point. It's specifically crafted for dividend and fundamental investors who are tired of paying Bloomberg Terminal prices but still want that institutional-grade data. We're talking instant access to dividends, yields, payout ratios, growth rates, full financial statements, earnings, key ratios, price history, and over 100 other metrics. The best part? You just type something like =DIVIDENDDATA_DIVIDENDS("MSFT") and bam, the data appears live. It's got a legit free tier that doesn't ghost you after a trial (2,500 credits monthly, forever), covers over 80,000 tickers with 30+ years of history, and was built by a dividend investor who actually gets what you need. This is for the investor who wants to level up their research game without the institutional price tag or headache.
About echoloc
Echoloc is a revolutionary platform that’s shaking up the sales game by helping pros uncover those sneaky buying signals hidden in job postings. Imagine you’re a sales development rep or an account executive, and instead of waiting for traditional intent data, you’re getting the jump on potential buyers before they even realize they’re in the market. By analyzing a whopping 10 million job listings and tracking over 30 million companies, Echoloc serves up real-time insights that let you know when a business is gearing up to invest in new tech or services. Think about it: when a company advertises for its first data engineer or ramps up its sales team, it's a clear sign they’re ready to grow and spend. Echoloc arms sales teams with concrete evidence from job descriptions, making outreach not only timely but super targeted. This means you can stay one step ahead of competitors and ride the wave of buyer intent before it becomes mainstream.
Frequently Asked Questions
Dividend Data FAQ
Is there really a free plan?
Yes, for real! The free plan gives you 2,500 credits every single month, and it never expires. No credit card needed to start. It's perfect for individual investors doing periodic research. You're not getting a 7-day trial that forces you to pay; you get a permanently useful free tier.
How do I get started? Is it complicated?
Not at all. If you use Google Sheets, just install the add-on from the Google Workspace Marketplace. For Excel, get it from Microsoft AppSource. Once installed, a sidebar will appear, and you can start typing the =DIVIDENDDATA... formulas directly into your cells. No coding, no API key setup.
What's the difference between the Spreadsheet add-in and the Pro Terminal?
The Spreadsheet add-in is about getting data into your existing workflow (Sheets/Excel). The Pro Terminal is their full web application with advanced data visualizations, the AI Analyst for chat-based research, and automated portfolio tracking tools. They complement each other; many users start with the spreadsheets and upgrade to the Terminal for deeper analysis.
What counts as a "credit"?
A credit is typically used each time you call a formula that fetches new data. For example, using =DIVIDENDDATA_QUOTE("AAPL", "price") might cost 1 credit. Pulling a longer history might cost a few more. The system is designed so the 2,500 free credits are plenty for substantial individual use.
echoloc FAQ
How does echoloc identify buying signals?
Echoloc analyzes job postings to identify patterns that indicate when a company is likely to invest in new technologies or services, turning HR data into actionable sales insights.
Can I customize my searches on echoloc?
Absolutely! You can search using plain English queries to find specific hiring signals, making it super easy to discover opportunities that align with your sales strategy.
Is the data on echoloc updated in real-time?
Yes! Echoloc provides real-time updates on job postings and hiring trends, ensuring you always have the latest information to drive your sales efforts.
What types of companies can I track with echoloc?
You can track a diverse range of companies across various industries. With over 30 million companies in their database, you’re bound to find leads that fit your target market perfectly.
Alternatives
Dividend Data Alternatives
So you've heard about Dividend Data, the tool that slaps 30+ years of stock market intel for 80k+ tickers straight into your Sheets or Excel. No API keys, no coding, just simple formulas. It's basically the cheat code for dividend and fundamental investors who want deep data without the Wall Street price tag. People hunt for alternatives for all the usual suspects. Maybe the pricing feels off, they need a feature that's missing, or their workflow lives on a different platform entirely. It's all about finding the right fit for your specific investing grind. When you're scoping out other options, keep your non-negotiables front of mind. Think about your budget (free tiers are a vibe), the specific data points you absolutely need, whether it plays nice with your spreadsheet of choice, and if the historical data goes back far enough for your strategy. Don't sleep on the user experience either—if it's clunky, you just won't use it.
echoloc Alternatives
Echoloc is this super slick platform that helps sales teams spot potential buyers by analyzing job postings for hidden buying signals. Basically, it’s all about giving those sales peeps the inside scoop on when companies are gearing up to invest in new tech or services. No more guessing games; Echoloc lays it all out there, making it easier for SDRs and AEs to get their game on and target the right accounts. Now, why do folks start searching for alternatives? Well, it might be about the price tag, specific features that don’t quite hit the mark, or maybe they need a platform that jives better with their existing workflow. When hunting for an alternative, keep an eye out for user-friendliness, integration capabilities, and whether it offers the kind of insights you really need to stay ahead of the competition.