Dividend Data vs GrowPanel
Side-by-side comparison to help you choose the right AI tool.
Dividend Data
Stop copy-pasting stock data and just use a formula to get dividends and financials instantly in your spreadsheet.
Last updated: March 11, 2026
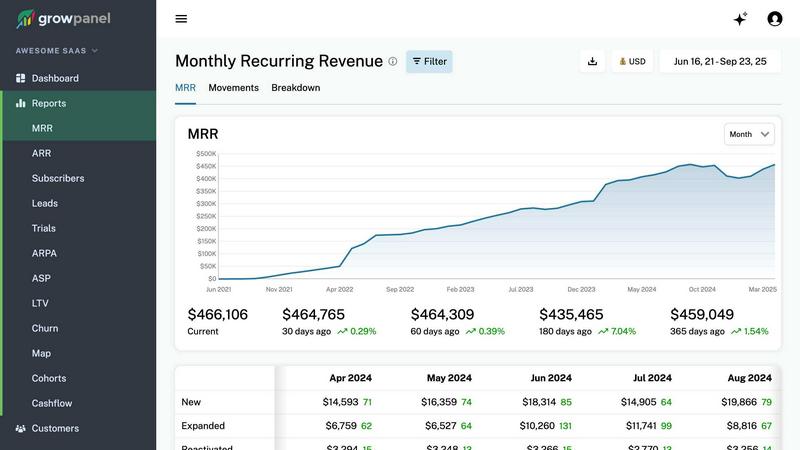
GrowPanel
Stop guessing about your SaaS cash, get real-time revenue and churn stats that slap.
Last updated: February 28, 2026
Visual Comparison
Dividend Data

GrowPanel
Feature Comparison
Dividend Data
Spreadsheet Superpowers
This is the core magic. The add-in gives you a library of custom functions (like DIVIDENDDATA_DIVIDENDS, DIVIDENDDATA_RATIOS, etc.) that work directly in your cells. No more tab-hopping to finance sites. You build your own live, updating financial models and dashboards right inside the comfort of Google Sheets or Excel. It automates the tedious data-grunt work so you can focus on the actual analysis.
Deep Dividend & Fundamental Data Dive
Built for the income-focused crowd, it delivers the specific metrics you crave. Get forward dividends, yields, ex-dates, payout ratios, and dividend growth rates instantly. But it doesn't stop there; you also get the full context with PE ratios, EPS, revenue, balance sheet items, and over 100 other fundamental metrics. It's like having a direct feed from the market's brain into your spreadsheet.
30+ Years of Historical Context
You can't make smart decisions with just today's data. Dividend Data hooks you up with decades of historical data for those 80,000+ tickers. This lets you backtest strategies, analyze long-term trends, calculate compound growth rates, and see how a company performed through different market cycles. It's your financial time machine, no DeLorean required.
AI-Powered Research Assistant (Pro Terminal)
Beyond the spreadsheets, their flagship web app, the Dividend Data Terminal, includes an AI Analyst. This is your on-demand research buddy. Chat with it to get summaries, ask complex questions about stocks, and generate insights without digging through 10-Ks yourself. It supercharges your initial research phase before you even build your spreadsheet model.
GrowPanel
Blazing-Fast Real-Time Dashboards
Forget waiting for end-of-month reports to drop. GrowPanel's dashboards update in real-time, giving you instant visibility into your MRR, ARR, churn, and LTV. The UI is stupidly fast, designed for zero lag, so you can track daily trends, spot anomalies as they happen, and make decisions without any annoying loading screens. It's your business heartbeat, live and unfiltered.
Deep-Dive Cohort & Segmentation Wizardry
This is where you go from surface-level stats to galaxy-brain insights. Slice and dice your revenue by literally anything: plan, country, currency, billing frequency, or any custom attribute you send. Create cohorts to see how specific groups of customers behave over time, track trial conversion patterns, and visualize churn reasons with clean pie charts. It’s your secret weapon to understand exactly who your best (and worst) customers are.
AI-Powered Data Chat (No SQL Required)
Stop clicking through a million filters. Just ask. With GrowPanel AI, you can type questions in plain English like "What's our churn in Europe this quarter?" or "Show me expansion revenue for our Pro plan." It understands SaaS lingo deeply and serves up answers instantly, letting you drill down on the fly. It's like having a data analyst on speed dial, 24/7.
Cashflow Clarity & Failed Payment Radar
GrowPanel doesn't just show you top-line revenue; it shows you the actual money moving in and out. Track everything: recurring revenue, one-time charges, refunds, discounts, fees, taxes, and even FX losses. Its failed payment tracking is a game-changer, giving you recovery insights to slash involuntary churn. You can project your end-of-month cash position with confidence, so no nasty surprises.
Use Cases
Dividend Data
Building a Dynamic Dividend Dashboard
Create a master spreadsheet that tracks your entire watchlist or portfolio. Use formulas to pull in live dividend yields, next ex-dates, payout ratios, and stock prices. Watch it update automatically, giving you a real-time snapshot of your income investments without manual refreshes. Perfect for tracking your dividend calendar.
Screening for Dividend Aristocrats & Growers
Use the historical data functions to screen for stocks with a proven track record. Build formulas that check for consecutive years of dividend growth, analyze growth rates over 5 or 10 years, and filter by safe payout ratios. You can create a powerful, custom stock screener that lives right in your Sheets or Excel.
Performing Deep-Dive Company Analysis
When you find a interesting stock, go deep. Pull 10 years of income statements, balance sheets, and cash flow statements directly into a sheet to build your own financial models and ratio analysis. Calculate trends in debt, margins, and returns on equity without ever leaving your workbook.
Automating Portfolio Performance Reports
Link your portfolio holdings and use Dividend Data to automatically pull in current prices, dividend amounts, and YTD performance metrics. Combine this with your share counts to calculate total portfolio value, projected annual income, and overall yield. Automate your monthly or quarterly performance review reports.
GrowPanel
The Founder Needing Instant, Trusted Metrics
You're a SaaS founder juggling a million things. You need to know your exact MRR and runway at a glance before a board call or investor chat. With GrowPanel, you open the mobile app, tap once, and have all your key metrics—ARR, churn, cash flow—right in your pocket. No more scrambling through spreadsheets; just trusted, real-time data to back up your decisions and storytelling.
The Ops Team Slashing Involuntary Churn
Your customer success team is firefighting cancellations, but what about the silent revenue killer: failed payments? GrowPanel identifies failed payment patterns, shows recovery rates, and provides actionable insights. Your ops team can set up Slack alerts for failed charges and proactively save revenue, turning a leaky bucket into a sealed vault.
The Finance Pro Seeking Audit-Ready Reports
You need clean, detailed cash flow reporting for month-end closes, forecasting, or audits. GrowPanel consolidates all transaction data—fees, refunds, taxes, FX—into one clear dashboard. You can filter by currency, switch reporting currency instantly, and export scheduled reports via email. It brings order to the financial chaos, making reconciliation a breeze.
The Growth Marketer Optimizing Trial Conversions
You're running paid ads and need to know which channels bring the highest-quality trials that actually convert. Using GrowPanel's cohort analysis, you can segment trial users by source, track their conversion journey, and identify the exact moment they drop off. This lets you double down on what works and fix what's broken, turning more free users into paying fans.
Overview
About Dividend Data
Alright, let's cut through the Wall Street jargon. Dividend Data is your new bestie for stock analysis, but it lives where you already work: your spreadsheet. Think of it as a magic wand for Google Sheets and Microsoft Excel that summons decades of stock market intel with a simple formula. Done with copying and pasting data from sketchy websites or wrestling with complex API keys? This tool is built for that exact pain point. It's specifically crafted for dividend and fundamental investors who are tired of paying Bloomberg Terminal prices but still want that institutional-grade data. We're talking instant access to dividends, yields, payout ratios, growth rates, full financial statements, earnings, key ratios, price history, and over 100 other metrics. The best part? You just type something like =DIVIDENDDATA_DIVIDENDS("MSFT") and bam, the data appears live. It's got a legit free tier that doesn't ghost you after a trial (2,500 credits monthly, forever), covers over 80,000 tickers with 30+ years of history, and was built by a dividend investor who actually gets what you need. This is for the investor who wants to level up their research game without the institutional price tag or headache.
About GrowPanel
Alright, let's cut through the noise. If you're running a SaaS company, you know the drill: your revenue data is trapped in a dozen spreadsheets, your billing platform's native reports are kinda mid, and you're spending more time wrestling with numbers than actually using them to grow. Enter GrowPanel. This is your subscription analytics wingman, built to obliterate spreadsheet chaos and give you crystal-clear, real-time visibility into your money game. Founded by Lasse Schou, who literally scaled a SaaS biz from zero to a $10M ARR hero, GrowPanel is built by people who've been in the trenches. It's for SaaS founders, ops peeps, and finance teams who are tired of guessing and ready for knowing. Connect your billing platform (Stripe, Chargebee, you name it) with one click and boom – instant, beautiful dashboards showing MRR, ARR, churn, retention, expansion, and cohort analysis. It's like having a SaaS CFO built right into your dashboard, but way cooler and without the fancy suit. The best part? It's free until you're crushing it with over $200k ARR. Oh, and it's EU-hosted and GDPR-compliant, so your data is safe and sound. Stop managing data and start mastering your business.
Frequently Asked Questions
Dividend Data FAQ
Is there really a free plan?
Yes, for real! The free plan gives you 2,500 credits every single month, and it never expires. No credit card needed to start. It's perfect for individual investors doing periodic research. You're not getting a 7-day trial that forces you to pay; you get a permanently useful free tier.
How do I get started? Is it complicated?
Not at all. If you use Google Sheets, just install the add-on from the Google Workspace Marketplace. For Excel, get it from Microsoft AppSource. Once installed, a sidebar will appear, and you can start typing the =DIVIDENDDATA... formulas directly into your cells. No coding, no API key setup.
What's the difference between the Spreadsheet add-in and the Pro Terminal?
The Spreadsheet add-in is about getting data into your existing workflow (Sheets/Excel). The Pro Terminal is their full web application with advanced data visualizations, the AI Analyst for chat-based research, and automated portfolio tracking tools. They complement each other; many users start with the spreadsheets and upgrade to the Terminal for deeper analysis.
What counts as a "credit"?
A credit is typically used each time you call a formula that fetches new data. For example, using =DIVIDENDDATA_QUOTE("AAPL", "price") might cost 1 credit. Pulling a longer history might cost a few more. The system is designed so the 2,500 free credits are plenty for substantial individual use.
GrowPanel FAQ
How does the "free until $200k ARR" thing actually work?
It's exactly what it sounds like, no cap. You can sign up, connect your billing platform, and use the full power of GrowPanel completely for free. There are no feature limits or sneaky trial periods. Once your company's Annual Recurring Run Rate (ARR) crosses the $200,000 threshold, you'll move onto a paid plan. It's their way of supporting early-stage SaaS grinders.
What billing platforms can I connect?
GrowPanel plays nice with all the major players in the subscription billing game. You can connect Stripe, Chargebee, and Recurly directly with a single click. They also support connecting to "any billing source" via their API, so if you have a custom setup, you can likely pipe your data in too. The connection is read-only, so it's totally safe for your financial data.
Is my data secure with GrowPanel?
Big yes. GrowPanel is super serious about security and privacy. All your data is hosted on servers within the European Union, ensuring compliance with strict EU data protection laws. They are fully GDPR compliant, so you can rest easy knowing your sensitive revenue and customer data is handled with the highest standards of security and privacy.
Can I really use it fully on my phone?
Absolutely, and it slaps. GrowPanel is built mobile-first from the ground up. You're not getting a watered-down version; you get the full desktop experience in your pocket. You can switch between connected accounts with a tap, apply complex filters, drill down into any metric, and even use the AI chat. All your dashboards and reports are fully responsive and optimized for mobile.
Alternatives
Dividend Data Alternatives
So you've heard about Dividend Data, the tool that slaps 30+ years of stock market intel for 80k+ tickers straight into your Sheets or Excel. No API keys, no coding, just simple formulas. It's basically the cheat code for dividend and fundamental investors who want deep data without the Wall Street price tag. People hunt for alternatives for all the usual suspects. Maybe the pricing feels off, they need a feature that's missing, or their workflow lives on a different platform entirely. It's all about finding the right fit for your specific investing grind. When you're scoping out other options, keep your non-negotiables front of mind. Think about your budget (free tiers are a vibe), the specific data points you absolutely need, whether it plays nice with your spreadsheet of choice, and if the historical data goes back far enough for your strategy. Don't sleep on the user experience either—if it's clunky, you just won't use it.
GrowPanel Alternatives
So you're looking for something like GrowPanel? It's a slick, no-spreadsheet-required analytics tool that gives SaaS founders the real-time tea on their MRR, churn, and LTV. Basically, it's your revenue dashboard on steroids, pulling data straight from Stripe or other billing platforms. People hunt for alternatives for all sorts of reasons. Maybe the pricing model doesn't vibe after you scale past that sweet free tier, or you need a specific integration that's not on the menu. Sometimes you just want a different UI flavor or more granular control over your reports. When you're shopping around, keep your non-negotiables front of mind. Think about your must-have integrations, the specific metrics that keep you up at night, and your budget ceiling. Don't just chase feature lists—find the tool that actually fits into your daily grind and makes your data less of a mystery.