Dividend Data vs Redbark
Side-by-side comparison to help you choose the right AI tool.
Dividend Data
Stop copy-pasting stock data and just use a formula to get dividends and financials instantly in your spreadsheet.
Last updated: March 11, 2026
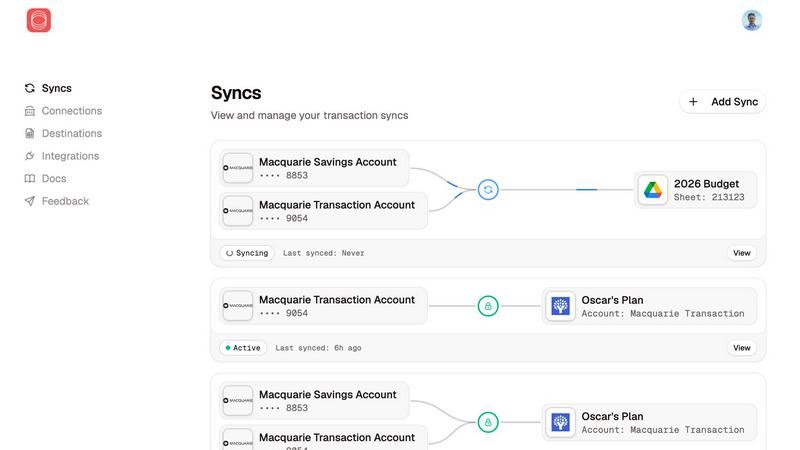
Sync your Aussie bank and brokerage data to Google Sheets and YNAB in real-time, no fuss or manual entry needed.
Last updated: March 4, 2026
Visual Comparison
Dividend Data

Redbark
Feature Comparison
Dividend Data
Spreadsheet Superpowers
This is the core magic. The add-in gives you a library of custom functions (like DIVIDENDDATA_DIVIDENDS, DIVIDENDDATA_RATIOS, etc.) that work directly in your cells. No more tab-hopping to finance sites. You build your own live, updating financial models and dashboards right inside the comfort of Google Sheets or Excel. It automates the tedious data-grunt work so you can focus on the actual analysis.
Deep Dividend & Fundamental Data Dive
Built for the income-focused crowd, it delivers the specific metrics you crave. Get forward dividends, yields, ex-dates, payout ratios, and dividend growth rates instantly. But it doesn't stop there; you also get the full context with PE ratios, EPS, revenue, balance sheet items, and over 100 other fundamental metrics. It's like having a direct feed from the market's brain into your spreadsheet.
30+ Years of Historical Context
You can't make smart decisions with just today's data. Dividend Data hooks you up with decades of historical data for those 80,000+ tickers. This lets you backtest strategies, analyze long-term trends, calculate compound growth rates, and see how a company performed through different market cycles. It's your financial time machine, no DeLorean required.
AI-Powered Research Assistant (Pro Terminal)
Beyond the spreadsheets, their flagship web app, the Dividend Data Terminal, includes an AI Analyst. This is your on-demand research buddy. Chat with it to get summaries, ask complex questions about stocks, and generate insights without digging through 10-Ks yourself. It supercharges your initial research phase before you even build your spreadsheet model.
Redbark
Seamless Bank Connections
Connect your Australian bank accounts and global brokerages effortlessly. Redbark supports over 100 banks and crypto exchanges, allowing your financial data to flow smoothly into your favorite productivity tools without breaking a sweat.
Real-time Syncing
Forget about waiting for updates. With Redbark, your bank transactions sync automatically, giving you real-time updates across Google Sheets, Notion, and YNAB. This means you can focus on what matters while your financial data stays fresh and up-to-date.
Pass-through Data Architecture
Your financial data flows directly from your bank to your destination without ever hitting Redbark's servers. This means enhanced security and privacy, making sure your sensitive info remains safe and sound, so you can chill knowing it's all secure.
Smart Deduplication
Worried about duplicate entries ruining your financial overview? Redbark’s intelligent deduplication feature catches late-posting transactions and eliminates duplicates, ensuring your data is clean and accurate every time you sync.
Use Cases
Dividend Data
Building a Dynamic Dividend Dashboard
Create a master spreadsheet that tracks your entire watchlist or portfolio. Use formulas to pull in live dividend yields, next ex-dates, payout ratios, and stock prices. Watch it update automatically, giving you a real-time snapshot of your income investments without manual refreshes. Perfect for tracking your dividend calendar.
Screening for Dividend Aristocrats & Growers
Use the historical data functions to screen for stocks with a proven track record. Build formulas that check for consecutive years of dividend growth, analyze growth rates over 5 or 10 years, and filter by safe payout ratios. You can create a powerful, custom stock screener that lives right in your Sheets or Excel.
Performing Deep-Dive Company Analysis
When you find a interesting stock, go deep. Pull 10 years of income statements, balance sheets, and cash flow statements directly into a sheet to build your own financial models and ratio analysis. Calculate trends in debt, margins, and returns on equity without ever leaving your workbook.
Automating Portfolio Performance Reports
Link your portfolio holdings and use Dividend Data to automatically pull in current prices, dividend amounts, and YTD performance metrics. Combine this with your share counts to calculate total portfolio value, projected annual income, and overall yield. Automate your monthly or quarterly performance review reports.
Redbark
Freelancers Managing Invoices
Freelancers can connect their bank accounts to Redbark, enabling seamless tracking of invoices and payments. With real-time syncing, they can easily manage cash flow and stay on top of their finances without the hassle of manual entry.
Investors Monitoring Portfolios
Investors can link their global brokerage accounts, making it simple to monitor investments in real-time. Redbark syncs transaction data directly to tools like Google Sheets, allowing for easy analysis and tracking of portfolio performance.
Small Business Owners Keeping Cash Flow in Check
Small business owners can utilize Redbark to manage their finances effortlessly. By syncing transactions from multiple accounts, they can keep their cash flow organized and make informed decisions based on live data.
Budgeting Enthusiasts Tracking Expenses
For those who love budgeting, Redbark makes it easy to sync transactions into budgeting tools like YNAB. This helps users maintain a clear view of their spending habits and adjust their budgets accordingly without any manual fuss.
Overview
About Dividend Data
Alright, let's cut through the Wall Street jargon. Dividend Data is your new bestie for stock analysis, but it lives where you already work: your spreadsheet. Think of it as a magic wand for Google Sheets and Microsoft Excel that summons decades of stock market intel with a simple formula. Done with copying and pasting data from sketchy websites or wrestling with complex API keys? This tool is built for that exact pain point. It's specifically crafted for dividend and fundamental investors who are tired of paying Bloomberg Terminal prices but still want that institutional-grade data. We're talking instant access to dividends, yields, payout ratios, growth rates, full financial statements, earnings, key ratios, price history, and over 100 other metrics. The best part? You just type something like =DIVIDENDDATA_DIVIDENDS("MSFT") and bam, the data appears live. It's got a legit free tier that doesn't ghost you after a trial (2,500 credits monthly, forever), covers over 80,000 tickers with 30+ years of history, and was built by a dividend investor who actually gets what you need. This is for the investor who wants to level up their research game without the institutional price tag or headache.
About Redbark
Redbark is your go-to financial buddy that streamlines the messy world of money management. Imagine connecting all your Aussie bank accounts and global investments directly to the tools you already vibe with, like Google Sheets, Notion, or Airtable. No more fiddling with clunky CSV imports or the mind-numbing task of manual data entry. Redbark takes the pain out of financial tracking by leveraging Australia's Consumer Data Right (CDR) framework, ensuring you get secure, bank-approved access to your transaction data with a few clicks. Everything syncs automatically on your chosen schedule, and your info never hangs out on Redbark's servers. It's all about simplicity and privacy, making it a perfect fit for freelancers keeping an eye on invoices, investors tracking their portfolios, small business owners managing cash flow, or anyone wanting an easy-peasy, automated view of their finances. And the setup? It’s a breeze—no coding skills needed. With support for a myriad of Australian banks, New Zealand banks, and global brokerages, Redbark is ready to transform your financial game.
Frequently Asked Questions
Dividend Data FAQ
Is there really a free plan?
Yes, for real! The free plan gives you 2,500 credits every single month, and it never expires. No credit card needed to start. It's perfect for individual investors doing periodic research. You're not getting a 7-day trial that forces you to pay; you get a permanently useful free tier.
How do I get started? Is it complicated?
Not at all. If you use Google Sheets, just install the add-on from the Google Workspace Marketplace. For Excel, get it from Microsoft AppSource. Once installed, a sidebar will appear, and you can start typing the =DIVIDENDDATA... formulas directly into your cells. No coding, no API key setup.
What's the difference between the Spreadsheet add-in and the Pro Terminal?
The Spreadsheet add-in is about getting data into your existing workflow (Sheets/Excel). The Pro Terminal is their full web application with advanced data visualizations, the AI Analyst for chat-based research, and automated portfolio tracking tools. They complement each other; many users start with the spreadsheets and upgrade to the Terminal for deeper analysis.
What counts as a "credit"?
A credit is typically used each time you call a formula that fetches new data. For example, using =DIVIDENDDATA_QUOTE("AAPL", "price") might cost 1 credit. Pulling a longer history might cost a few more. The system is designed so the 2,500 free credits are plenty for substantial individual use.
Redbark FAQ
How secure is my data with Redbark?
Your data is super secure with Redbark. We use AES-256 encryption and a pass-through architecture, meaning your financial info never hangs out on our servers. Plus, we're fully CDR compliant, so your data stays protected under Australian jurisdiction.
Can I use Redbark for international accounts?
Absolutely! Redbark supports not only Australian banks but also global brokerages and crypto exchanges, giving you a holistic view of your finances no matter where they are.
What if I want to change my syncing schedule?
No worries! You have complete control over your syncing schedule. Just hop into your Redbark dashboard, and you can adjust it to fit your needs—whether you want it daily, weekly, or monthly.
Is there a free trial available?
You bet! Redbark offers a free trial so you can test out all its awesome features without having to pull out your credit card. Go ahead and give it a spin!
Alternatives
Dividend Data Alternatives
So you've heard about Dividend Data, the tool that slaps 30+ years of stock market intel for 80k+ tickers straight into your Sheets or Excel. No API keys, no coding, just simple formulas. It's basically the cheat code for dividend and fundamental investors who want deep data without the Wall Street price tag. People hunt for alternatives for all the usual suspects. Maybe the pricing feels off, they need a feature that's missing, or their workflow lives on a different platform entirely. It's all about finding the right fit for your specific investing grind. When you're scoping out other options, keep your non-negotiables front of mind. Think about your budget (free tiers are a vibe), the specific data points you absolutely need, whether it plays nice with your spreadsheet of choice, and if the historical data goes back far enough for your strategy. Don't sleep on the user experience either—if it's clunky, you just won't use it.
Redbark Alternatives
Redbark is a modern financial tool designed to sync your Australian bank and brokerage data with apps like Google Sheets and YNAB, making it super easy to manage your finances without the hassle of manual entry. This nifty platform falls under the Business & Finance and Personal Finance categories, catering to freelancers, investors, and small business owners alike. Users often seek alternatives to Redbark due to reasons like pricing, specific feature needs, or compatibility with other platforms. When hunting for the right alternative, it's essential to consider factors like security, ease of use, and how well it integrates with your existing tools. Finding a solution that aligns with your financial management style can make all the difference.