Fusedash vs Master Metrics
Side-by-side comparison to help you choose the right AI tool.
Fusedash transforms your raw data into slick dashboards and charts, making insights easy to spot and act on fast.
Last updated: March 4, 2026
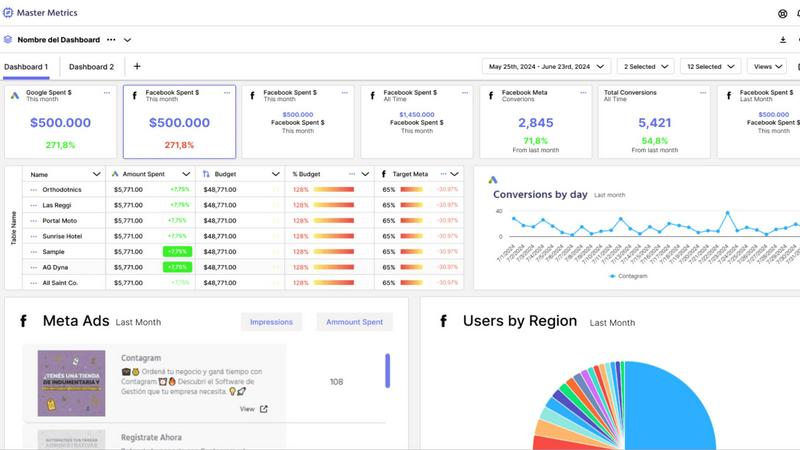
Master Metrics
Stop drowning in data and start crushing goals with AI-powered dashboards and alerts.
Last updated: February 28, 2026
Visual Comparison
Fusedash

Master Metrics
Feature Comparison
Fusedash
Flexible Views
Fusedash lets you customize how your data is presented, catering to the needs of different teams. Whether it's a dashboard, chart, map, or narrative report, you can tailor layouts, filters, and time ranges to make sure stakeholders get exactly what they need without endless back and forth.
AI Chart Generator
Generate stunning visuals from your data in just minutes! Fusedash's AI chart generator takes your CSVs or API data, helps you choose the right chart type, and lets you add comparisons and clear labels. This means your charts will not only look good but also tell the right story.
Dashboard Software
Combine monitoring with context in one sleek workspace. Fusedash allows you to create dashboards that track KPIs while also providing narrative reports to explain changes and their significance. This storytelling feature keeps everyone aligned and reduces confusion, ensuring that everyone knows what’s up.
AI Chat
Not sure where to start? No worries! Fusedash's Smart Chat lets you ask questions in plain language and get immediate suggestions for metrics, charts, and breakdowns. This feature makes it easy to turn insights into shareable dashboard views, speeding up the decision-making process.
Master Metrics
All-in-One Mission Control Dashboard
Forget juggling ten different tabs. Master Metrics is your single source of truth, pulling data from all your ads, social platforms, e-commerce stores, and more into one unified, clean dashboard. See everything that matters at a glance, customize your view, and finally understand what's actually working without the mental gymnastics. It's like having a 24/7 command center for your marketing performance.
AI-Powered Google Slides & Sheets Magic
Stop manually building reports and presentations. This feature is a total game-changer. Choose your data, pick a slick template, and let Master Metrics' AI generate a fully editable, client-ready Google Slides presentation in just a few clicks. Plus, it automatically pushes fresh, live data directly into your Google Sheets and Looker Studio. Your data is always current, and you never have to copy-paste again. Pure wizardry.
Smart, Proactive Alerts on Your Terms
Don't just watch your metrics; make them work for you. Set up custom alerts for anything: a campaign tanking, sales dipping, or a goal being smashed. Get notified via email, Slack, or WhatsApp the moment something important happens. You can even control your ad spend automatically with budget alerts. It's like having a hyper-vigilant guard dog for your KPIs, so you can focus on strategy, not spreadsheets.
Custom Metrics & Formula Builder
Got a unique business question that standard metrics can't answer? No problem. Master Metrics lets you build your own custom metrics and formulas by blending data from different sources. Want to see your cost-per-lead from Facebook Ads combined with close rates from your CRM? You can build that. It gives you the power to answer any "what if" and get insights tailored exactly to your business.
Use Cases
Fusedash
Marketing Campaign Tracking
Keep tabs on your marketing campaigns by utilizing Fusedash to create dashboards that show real-time performance metrics. You can visualize data trends and quickly adjust strategies based on what's working and what's not.
Sales Performance Monitoring
Sales teams can leverage Fusedash to track performance metrics across different regions or products. With customizable dashboards, you can visualize sales numbers, compare them against KPIs, and quickly identify areas for improvement.
Operational Efficiency Analysis
Operations teams can utilize Fusedash to monitor key performance indicators in real-time. By using storytelling features, you can provide context to the data, helping teams understand operational successes and challenges.
Financial Reporting
Finance departments can streamline their reporting processes with Fusedash. Create comprehensive dashboards that pull from multiple data sources, ensuring that stakeholders have access to accurate financial insights without the headache of manual reporting.
Master Metrics
For Agencies Managing Multiple Clients
Juggling data for 10, 20, or 50 different clients is a nightmare. Master Metrics lets you clone dashboard templates with one click for new accounts, keep everything in a centralized Overview Control Panel, and automate reporting for each client. You look incredibly organized and data-driven, while saving hours of manual work. It's the secret weapon for scaling your agency without losing your mind.
For Marketing Teams Needing Real-Time Insights
When you need to know now if a campaign is flopping or a viral post is blowing up, waiting for a weekly report is useless. With live dashboards and instant alerts sent to your team's Slack channel, everyone stays in the loop in real-time. Make pivots faster, double down on what's working, and keep the entire team aligned with up-to-the-minute data.
For Automating Client Reporting & Presentations
The dreaded monthly report grind is over. Use Master Metrics to automatically pull the latest data, generate a beautiful Google Slides deck with AI, and schedule it to be emailed directly to your clients. You deliver consistent, professional, and insightful presentations every time, freeing up your evenings and impressing your clients with your efficiency.
For Controlling Ad Spend & Campaign Budgets
Worried about blowing your monthly ad budget in the first week? Set up daily budget alerts in Master Metrics. It will calculate the daily spend needed to hit your target and notify you instantly if you're over or under. This gives you proactive control, prevents costly overspends, and ensures you're pacing perfectly toward your goals all month long.
Overview
About Fusedash
Fusedash is like that magical toolbox you always wanted for your data! It's an AI-driven data visualization platform that helps teams convert their connected data into clear, actionable insights. Whether you're in marketing, operations, or leadership, Fusedash is designed to make your life easier by eliminating those frustrating manual reporting cycles and conflicting data stories. Imagine a unified workspace where you can whip up decision-ready dashboards, interactive charts, detailed maps, and narrative reports without the hassle of piecing together different tools. With Fusedash, you set your key metrics and KPIs once, and then use those definitions across all views and reports, ensuring everyone in your organization is on the same page with the same trusted numbers. It's not just about monitoring what's happening; it's about understanding why it's happening. Thanks to integrated AI features like natural language data chat and smart visualization assistance, Fusedash makes data exploration and reporting not just faster, but also way more accessible. Turn your raw data into a shared source of truth that drives alignment and action. Say goodbye to chaos and hello to clarity!
About Master Metrics
Alright, let's get real. If you're running an agency or a marketing team, you're probably drowning in a sea of tabs, spreadsheets, and data points from a zillion different places. It's chaos, and trying to make sense of it all is a full-time job that nobody signed up for. Enter Master Metrics, your new analytics sidekick built by marketers who've been in the trenches and know the daily grind. This ain't just another dashboard tool; it's your mission control for all things marketing data. It pulls everything from your ad campaigns and social stats to e-commerce and CRM data into one gloriously clean spot. The main vibe? Simplifying the absolute chaos. You get smart dashboards, killer alerts that ping you on Slack or WhatsApp the second something goes sideways (or when you're absolutely crushing it), and it automates all that tedious reporting nonsense. The real big-brain move? Its AI can whip up client-ready Google Slides presentations and push live data straight into your Google Sheets. No more 2 AM copy-paste marathons. It's for teams who want to look like absolute data wizards without needing a PhD in spreadsheet sorcery. Maximize your results, minimize your headaches.
Frequently Asked Questions
Fusedash FAQ
How does Fusedash ensure data consistency?
Fusedash allows you to define your key metrics and KPIs once, which can then be reused across all views and reports. This ensures that every team in your organization is looking at the same trusted numbers, eliminating conflicting reports.
Can I integrate my existing data sources with Fusedash?
Absolutely! Fusedash lets you upload CSVs, connect APIs, and even enrich your datasets with public data. This flexibility means you can combine various data sources without having to rebuild your reports from scratch.
Is Fusedash user-friendly for non-technical users?
Definitely! Fusedash is designed to be intuitive and accessible. With features like the AI Chat, even those without a technical background can easily explore data, generate charts, and create dashboards without feeling overwhelmed.
What kind of support does Fusedash offer?
Fusedash provides various resources including demos, tutorials, and a knowledge base to help users get started. Their customer support team is also available to assist with any questions or issues you might encounter along the way.
Master Metrics FAQ
What data sources can I connect to Master Metrics?
You can connect all the major players you're already using! This includes platforms like Google Ads, Meta Ads, various social media channels, e-commerce platforms (like Shopify), and CRM systems. They're also constantly adding new integrations (with several "coming soon" on the list), so your toolkit keeps growing. It brings all that scattered data into one unified dashboard.
How does the AI presentation creator actually work?
It's shockingly simple. You just select the client account, choose the key metrics and goals you want to highlight, and pick a design template you like. Then, Master Metrics' AI does its thing: it analyzes the data, writes the insights in plain English, and builds a fully formatted, editable presentation in Google Slides for you. You get a professional deck in minutes, not hours.
Can I really get alerts on WhatsApp or Slack?
Absolutely, yes! This isn't just email alerts. You can configure your alerts to ping you directly in the tools your team lives in. Set a threshold for a metric (like "cost per conversion over $50"), and get an instant message in your Slack channel or a WhatsApp notification when it's triggered. It's perfect for staying on top of critical issues without constantly checking a dashboard.
Is there a limit to how many dashboards or alerts I can create?
This depends on your pricing plan. The entry-level "Freelancer" plan has limits on dashboards and doesn't include the Overview feature or AI Slides. As you move up through the "Basic," "Pro," and "Pro Plus" plans, you get access to more accounts, unlimited dashboards, alerts, and all the premium features. Check the pricing table to see which plan fits your scale.
Alternatives
Fusedash Alternatives
Fusedash is an AI-powered data visualization platform that transforms your raw data into slick dashboards and charts, making sure your squad can act on insights like a boss. It falls under the Analytics & Data and Business Intelligence categories, catering to teams that want to ditch the hassle of manual reporting and conflicting data stories. Users often search for alternatives when they feel like Fusedash might not fit their budget, lack specific features they need, or require compatibility with certain platforms. When hunting for an alternative, keep an eye out for pricing structures that align with your budget, essential features that meet your unique needs, and compatibility with your existing tools. It's all about finding a solution that keeps the vibe flowing and the insights rolling in without a hitch.
Master Metrics Alternatives
So you've heard the buzz about Master Metrics, the AI-powered dashboard tool that's basically a cheat code for marketing agencies drowning in data. It's the all-in-one analytics sidekick designed to pull your client data from ads, social, and e-commerce into one clean mission control center, automating reports and sending smart alerts so you can stop the 2 AM spreadsheet grind. But let's be real, sometimes the perfect tool for one squad isn't the right fit for yours. Maybe the pricing feels a bit steep for a bootstrapped team, or you're locked into a specific tech stack it doesn't play nice with. Perhaps you need a feature it just doesn't have yet, or your workflow is so unique you need something hyper-customizable. It's all good—the hunt for the right tool is part of the game. When you're scoping out other options, keep your non-negotiables front and center. Think about your budget, the specific platforms you must connect to, and how your team actually works day-to-day. Do you need insane customization, or just something that works out of the box? Nail down what "simplifying the chaos" really means for your crew before you dive into the endless list of contenders.